I have always been very open about being adopted, when that fact seemed pertinent to a conversation. Which was usually the case if I met another adoptee, parents considering adopting, and especially parents with young adopted children. Also whenever people comment about how much I look or sound like my mom (it happens a lot!), or look like my brother (not so much anymore, but often in K-12) — my family gets a good laugh when hearing this.
Being named Colleen Robledo, people just automatically assume I am Irish and Mexican (or some sort of Hispanic). Once I turned drinking age, I started calling myself a Latin Leprechaun (like the bar drink). I rarely bothered to correct people about those ethnic assumptions. The story was just too long. And having been raised by parents and extended families who are both very proud of their ethnic heritage and traditions, I just always felt Irish and Mexican.
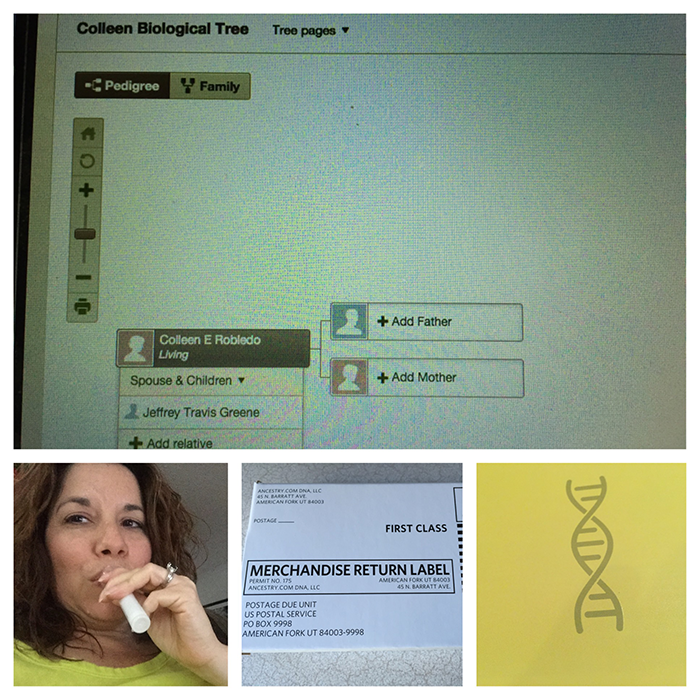
After doing Dad’s autosomal DNA analysis recently though, I became a bit more curious about my own genetic ethnicity. I blogged recently about finally taking my own autosomal DNA test, and beginning the search for my birth mother. That whole birth mom discovery has been quite a whirlwind process this past month. I finally have time to catch my breath a bit and take a harder look at the ethnicity projections about my own DNA.
Ethnicity Comparison
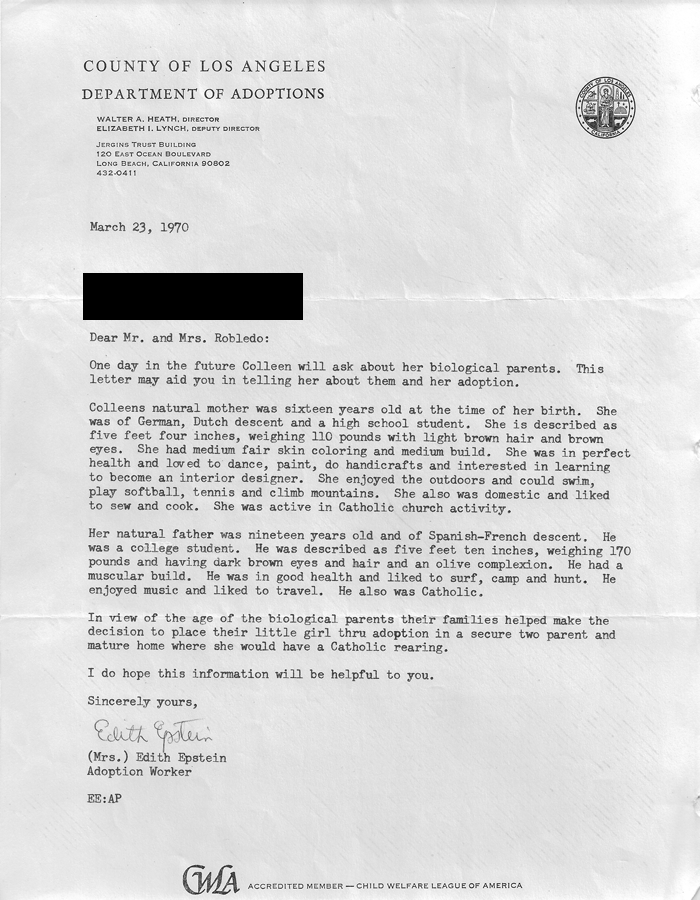
What My Adoption Letter Claims
I mentioned in my initial March 25th post about my adoption that the County of Los Angeles provided my parents with a letter at the time of my adoption to help them share with me a little bit about my birth parents — including their ethnicity. My adoption letter claims that my birth mom is of German and Dutch descent, while my birth dad is of Spanish and French descent.
By Spanish, I always assumed Mexican. The Chicano movement in Southern California hadn’t yet made being Mexican a more socially acceptable claim. The term “Spanish” was often still used as a euphemism for Mexican ancestry. So I just assumed that Los Angeles County did the same thing here — thinking that labeling an infant as Spanish instead of Mexican would make the baby more adoptable. Or that even my birth parents felt the same, and misidentified me to the county as Spanish instead of Mexican.
What DNA Tells Us
My adoption letter had been dead on accurate. Well, mostly accurate. The German, Dutch, and French part were all correct. So was the Spanish part. But, Spanish wasn’t my only Hispanic ethnicity. I am Spanish and Mexican.
Because I tested through AncestryDNA, theirs was the first set of ethnicity results to come back. I immediately transferred the raw Ancestry data to Family Tree DNA (FTDNA), and impatiently waited for their interpretation of my ethnicity. The two services did not provide me with as clean a comparison as I had first experienced reviewing Dad’s DNA results (his was like apples to apples, whereas mine felt like apples to oranges). Ancestry and FTDNA label and break down ethnic origins a bit differently, with Ancestry also providing estimates for much smaller sub-regions. Although from what I learned at RootsTech and FGS this past February, estimates at these smaller regional levels are not considered very accurate.
| AncestryDNA | Family Tree DNA |
|---|---|
| Europe 76% | European 80% |
| Europe West 32% | Western & Central Europe 11% |
| Great Britain < 1% | British Isles 30% |
| Ireland 6 % | |
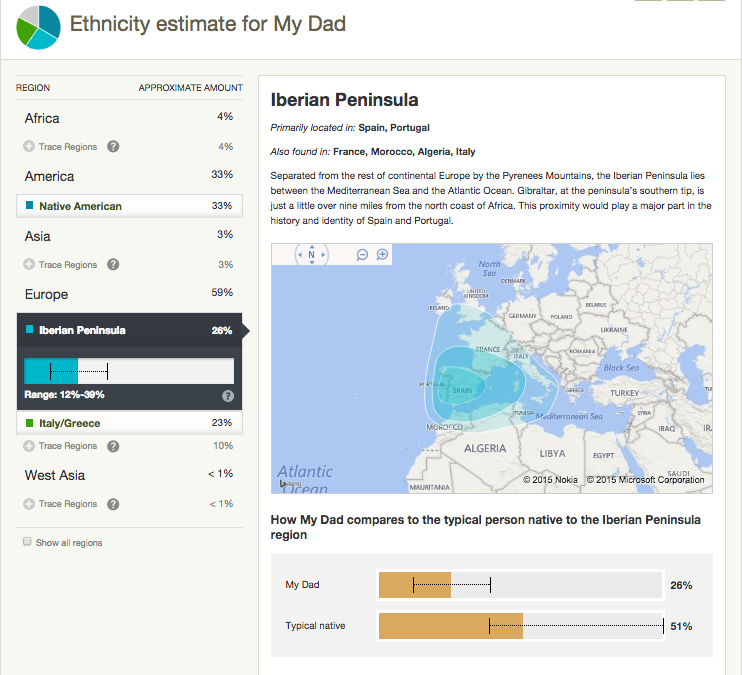
| Iberian Peninsula 16% | Southern Europe 29% |
| Scandinavia 16% | Scandinavia 9% |
| Finland & Northern Siberia 1% | |
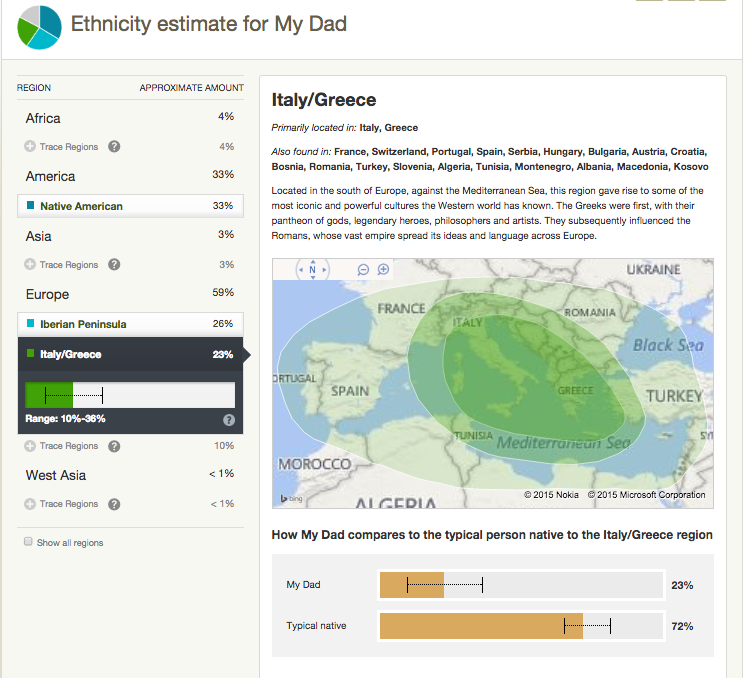
| Italy/Greece 5% | |
| European Jewish 1% | |
| America 21% | New World 13% |
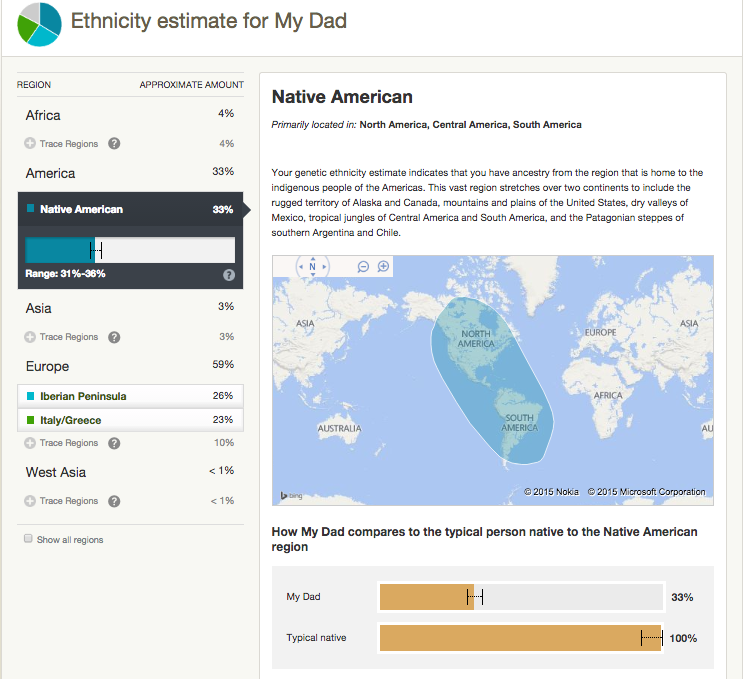
| Native American 21% | Native American 13% |
| Africa < 1% | |
| Africa North < 1% | |
| West Asia < 1% | Middle Eastern 1% |
| Middle East < 1% | North Africa 1% |
| Pacific Islander < 1% | East Asian 5% |
| Polynesia < 1% | Northeast Asia 5% |
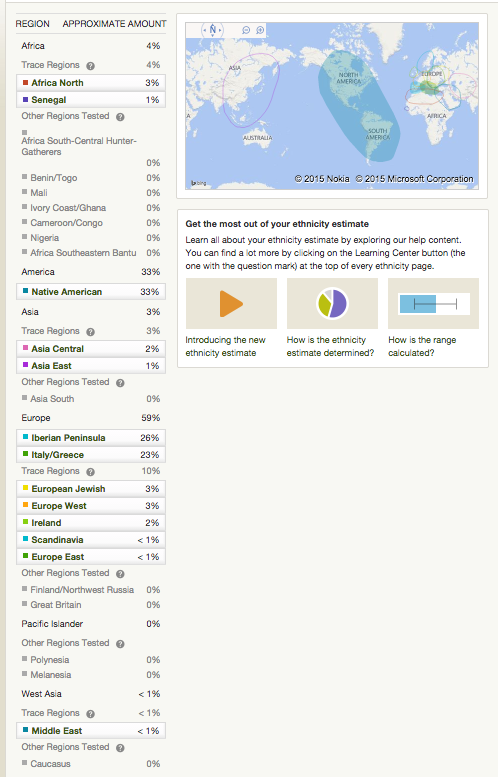
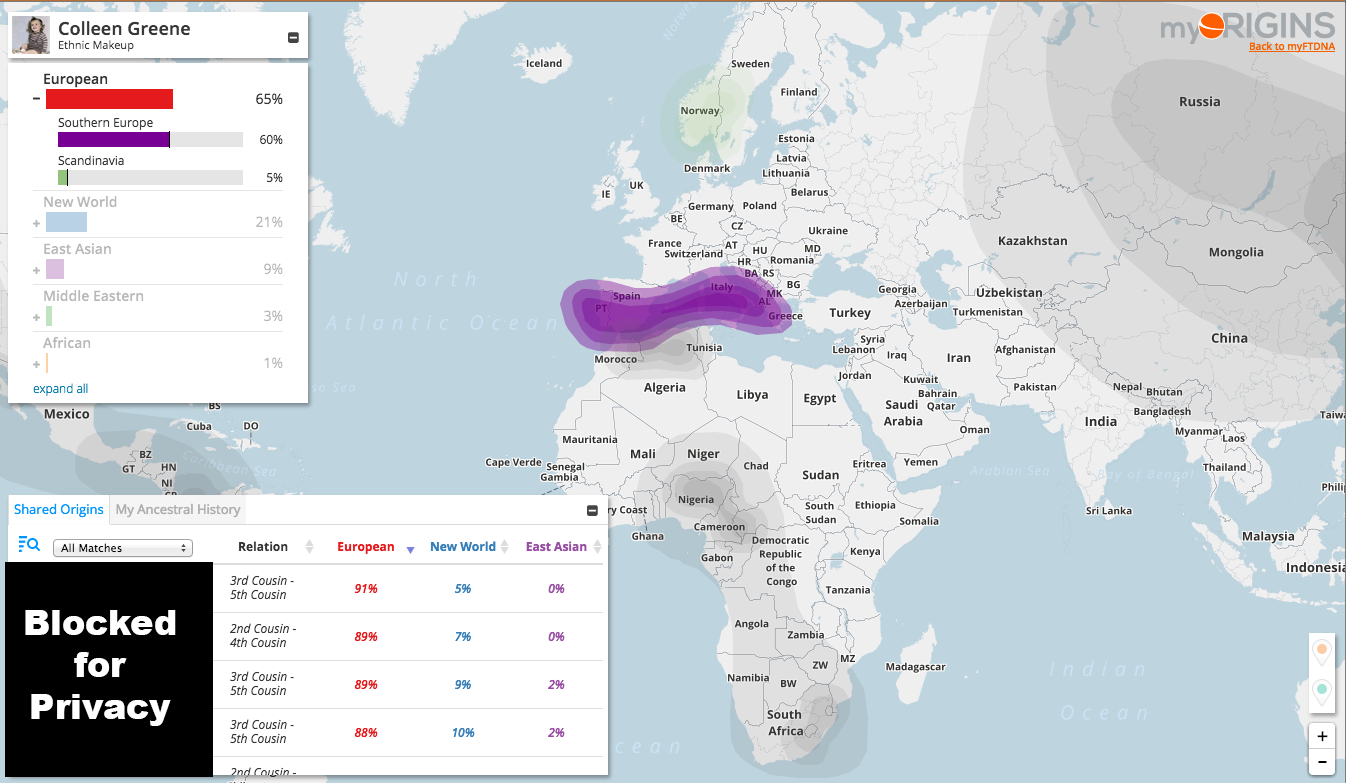
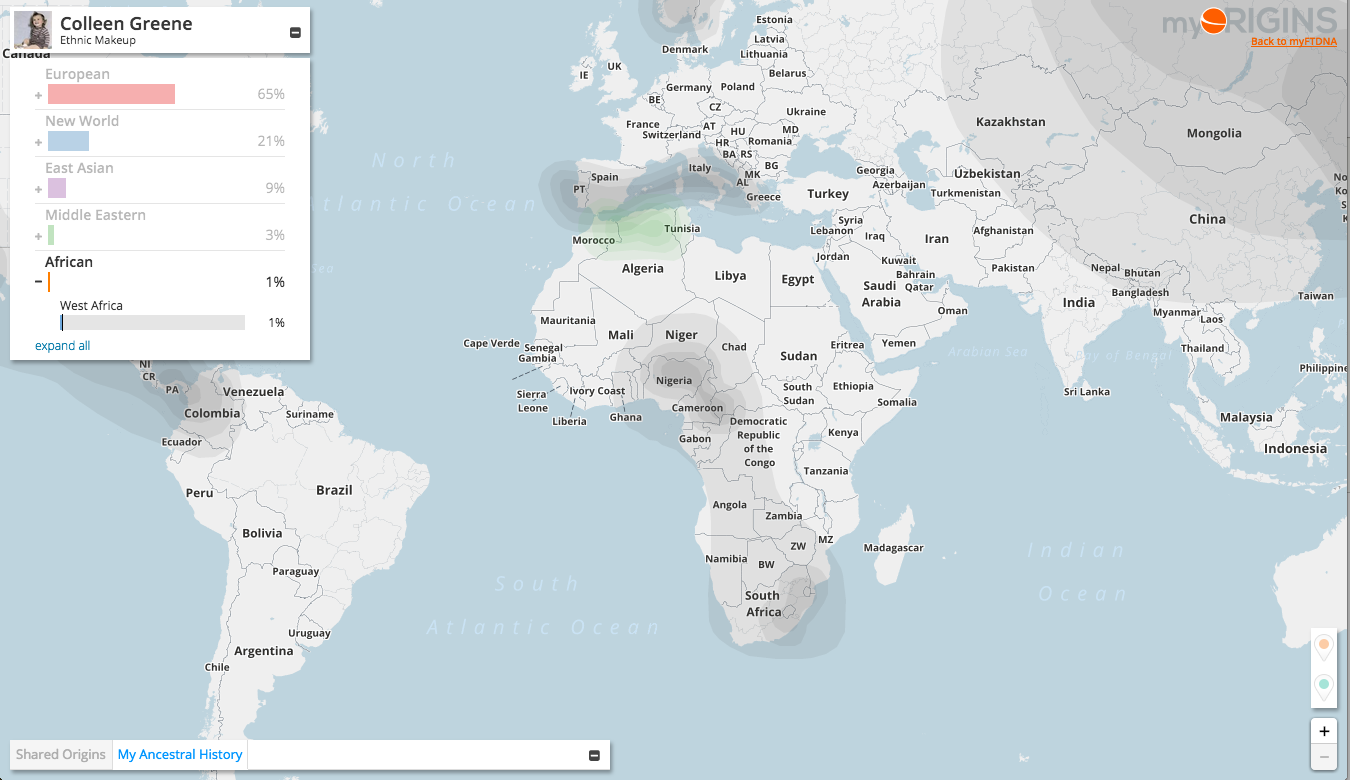
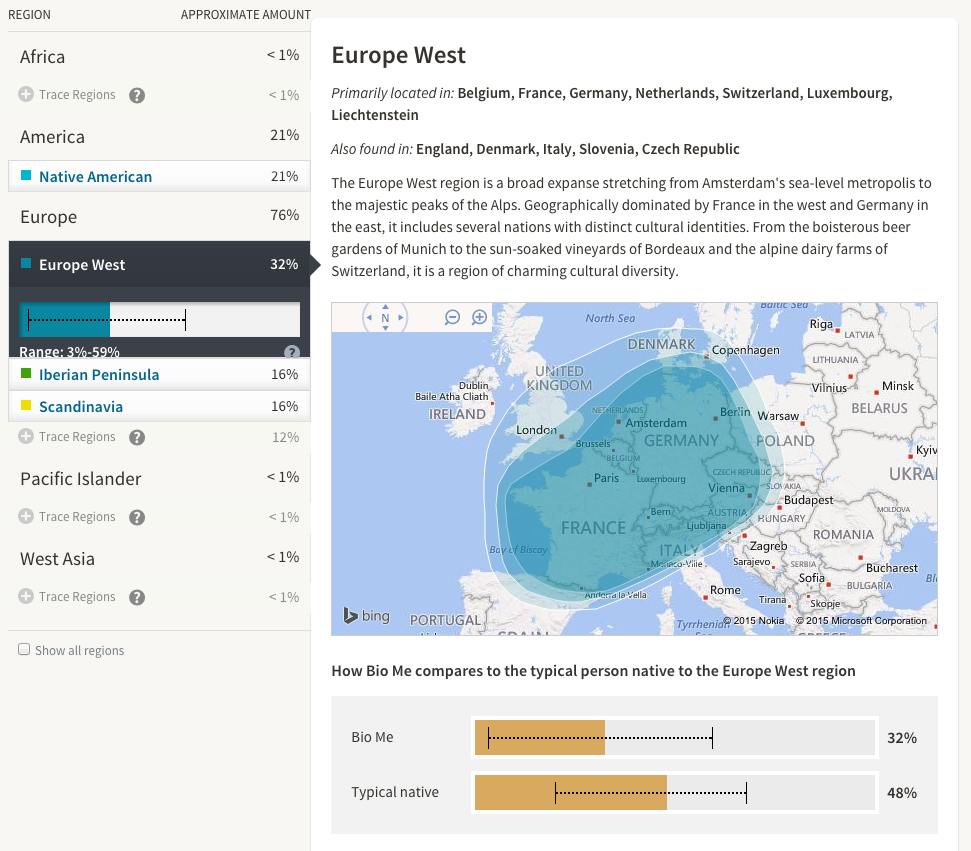
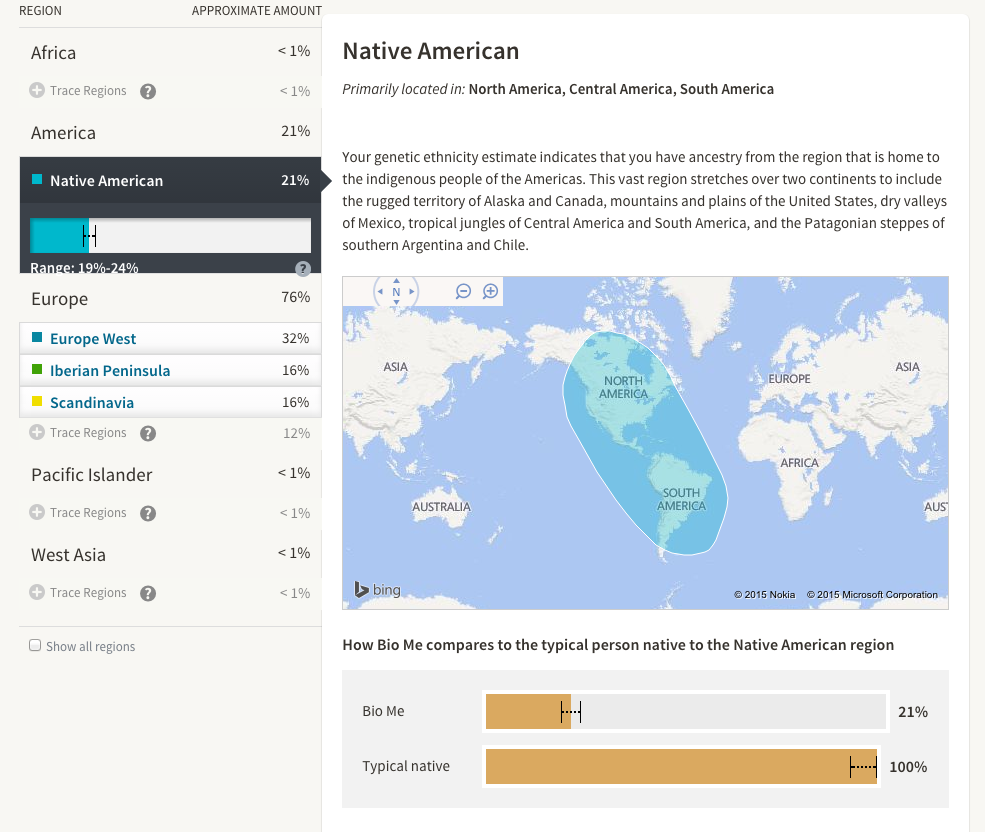
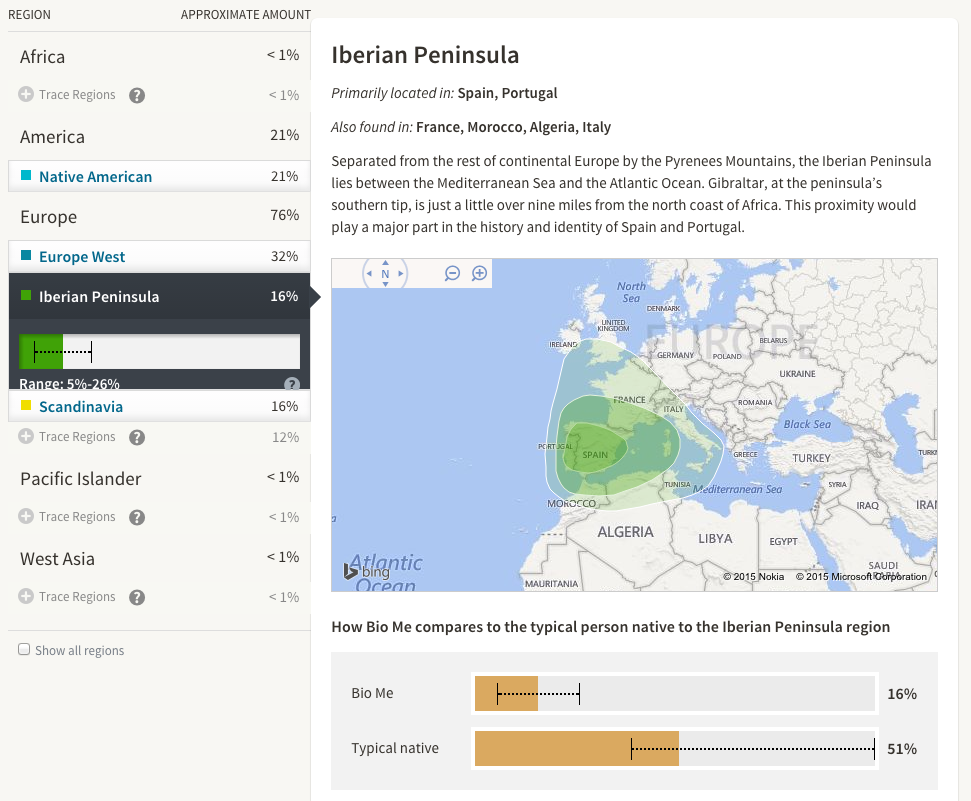
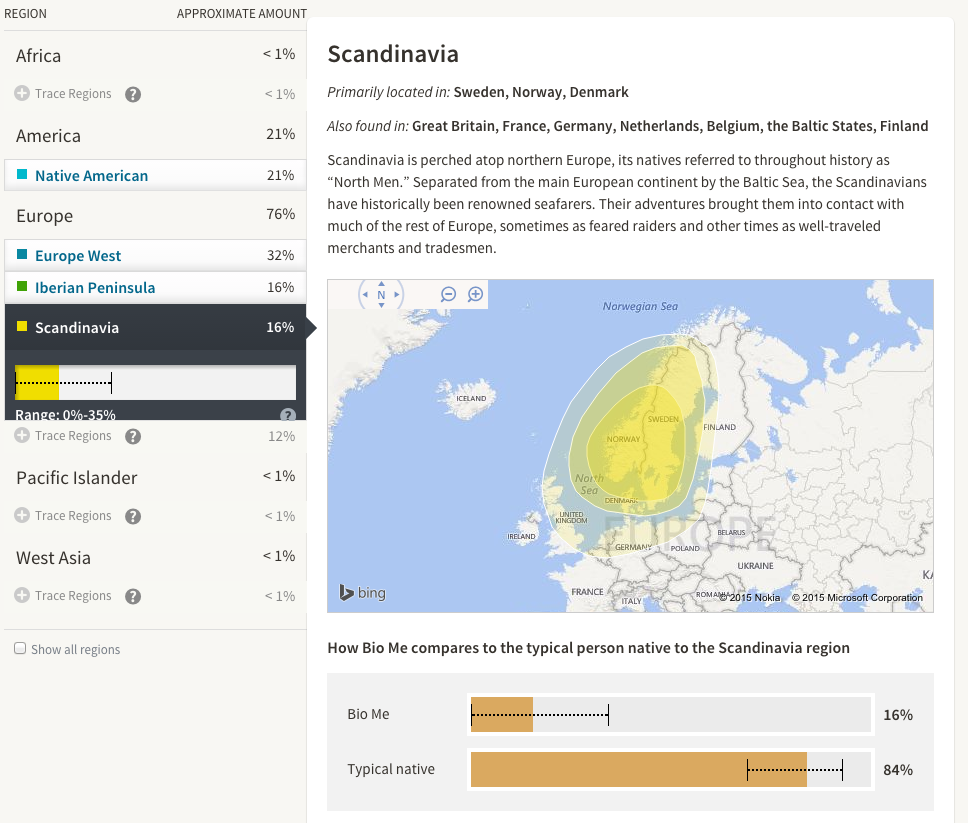
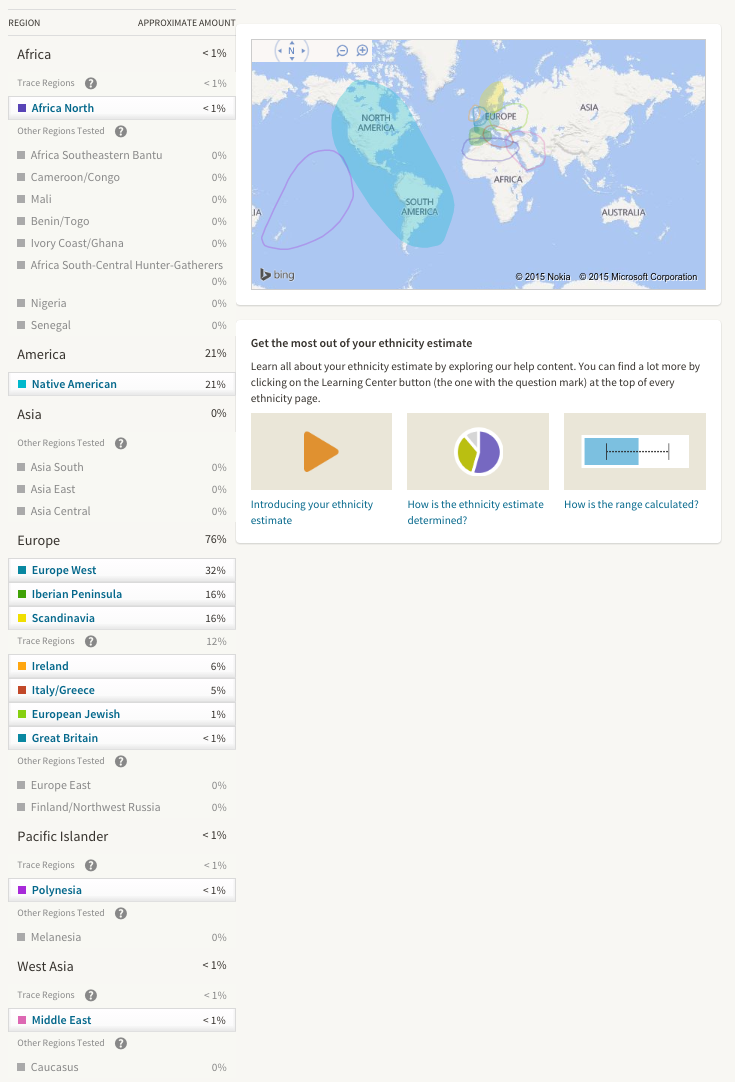
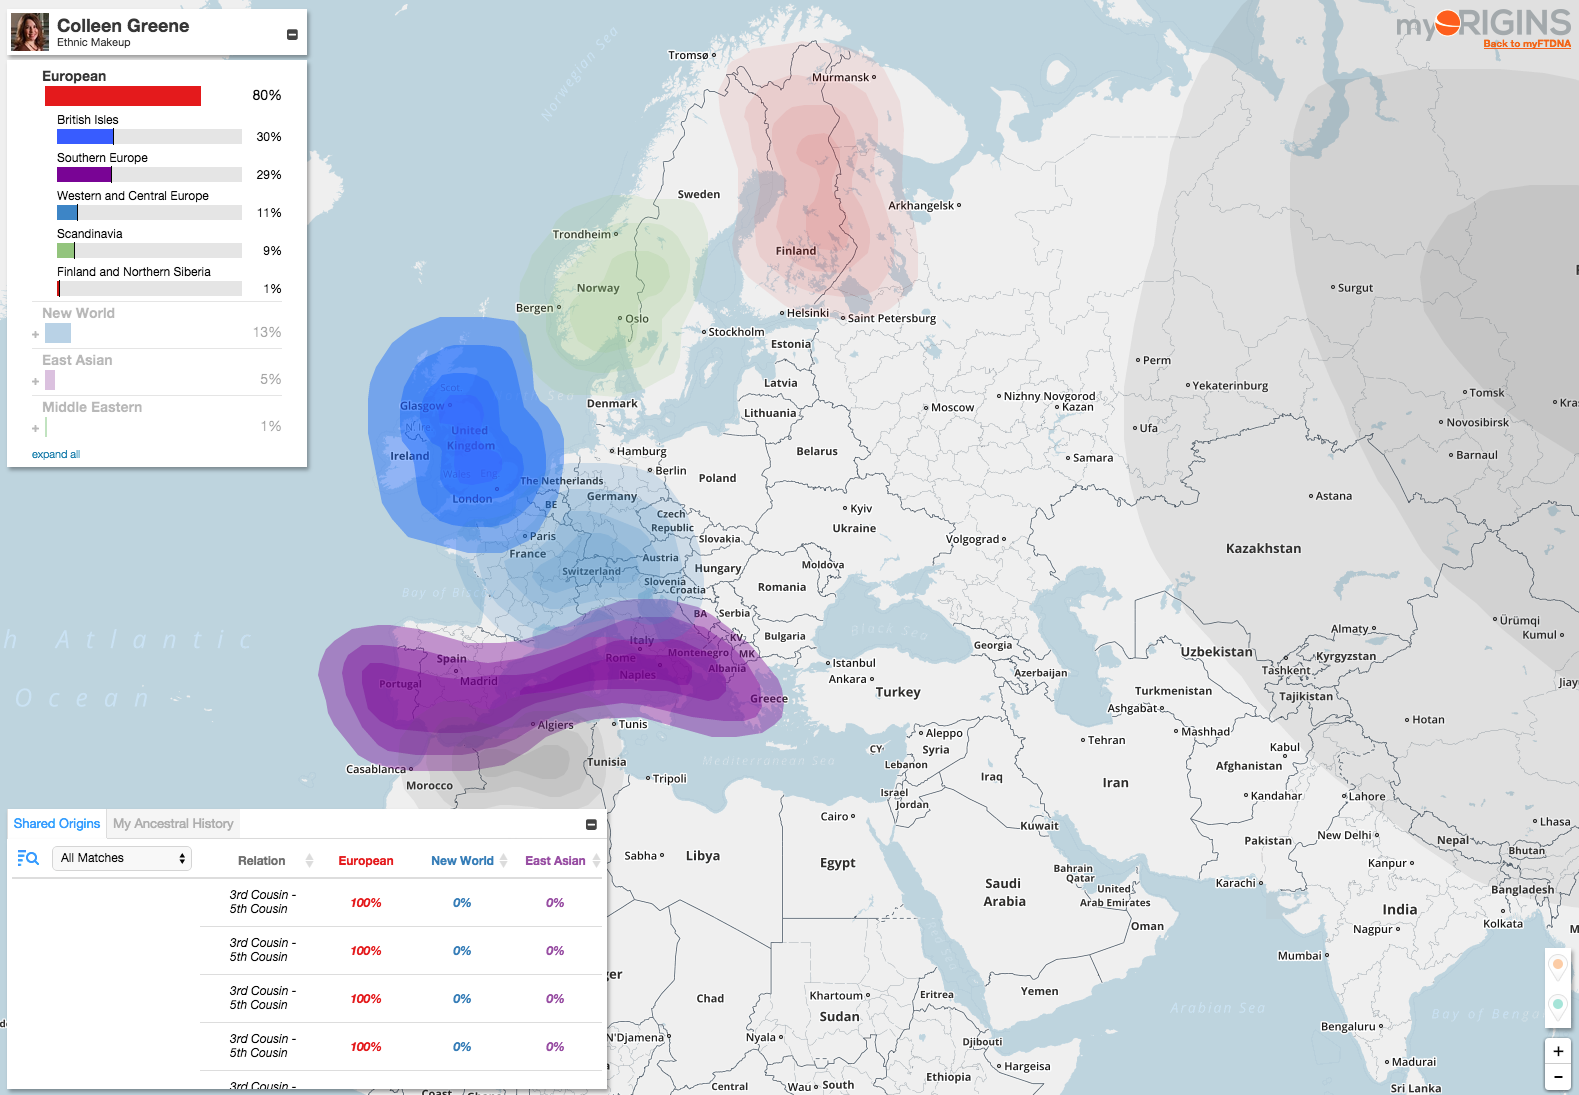
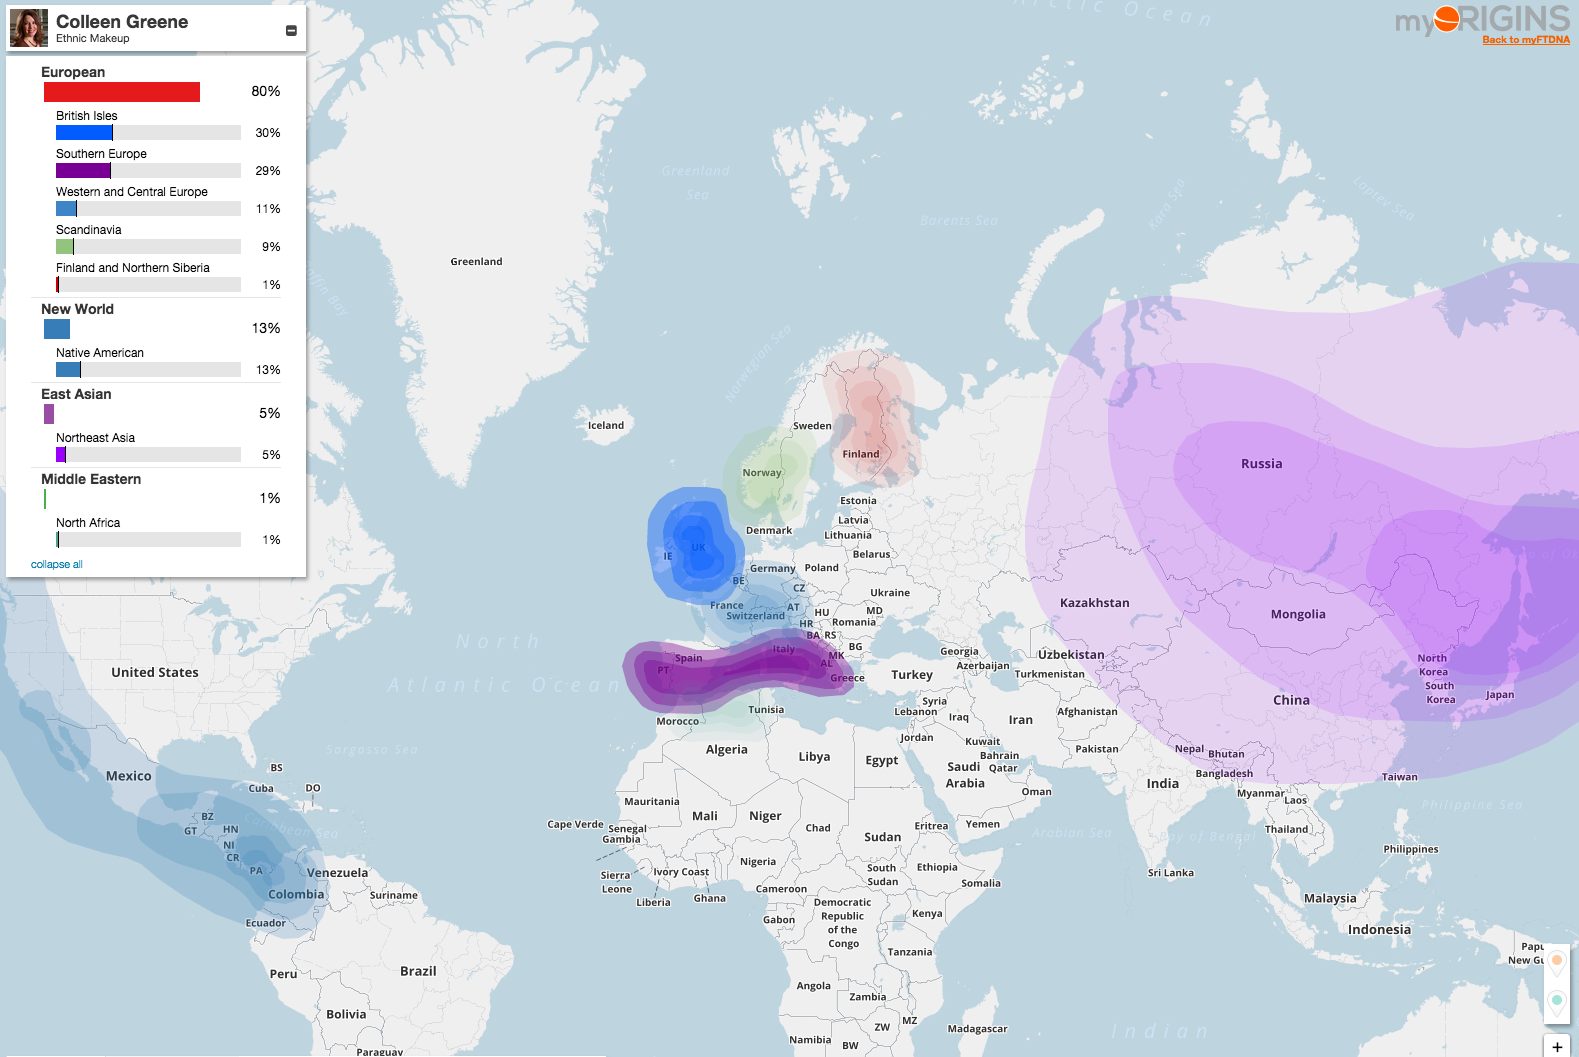
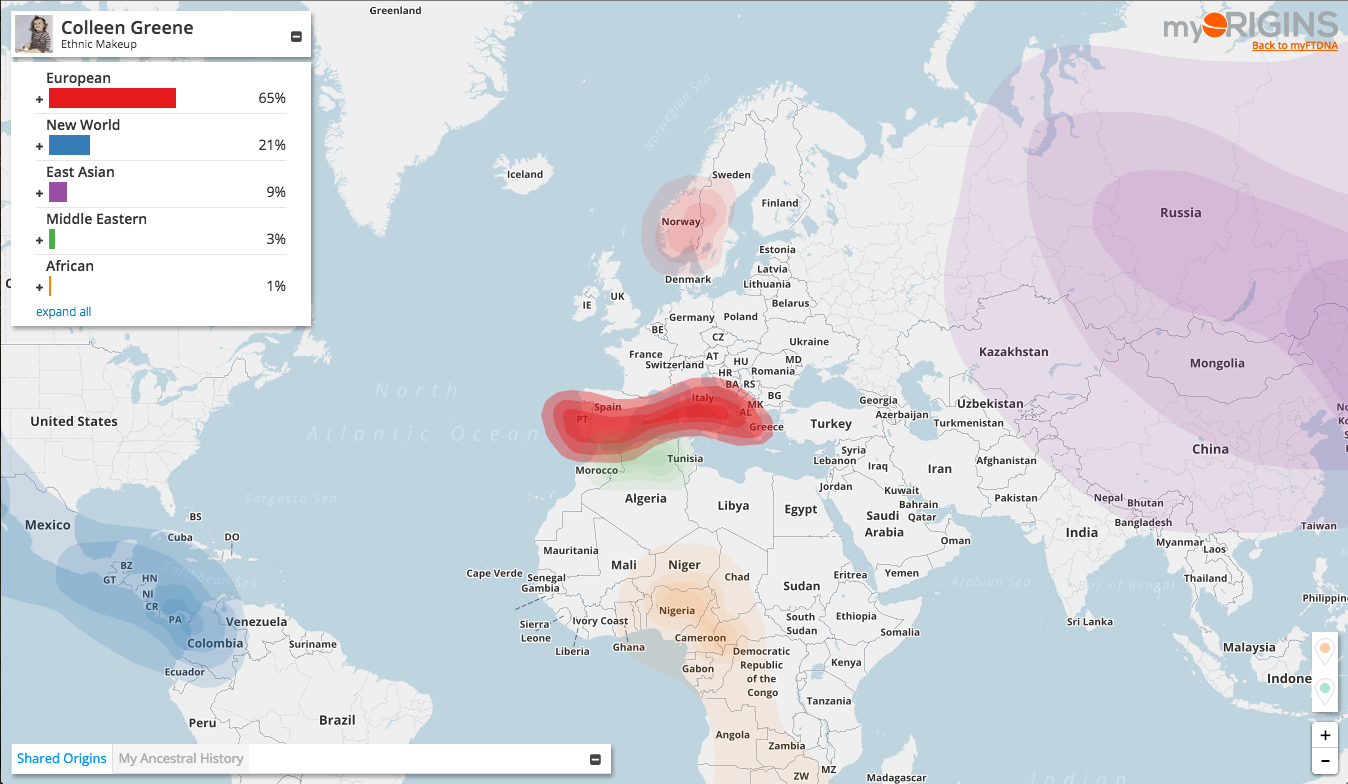
Both Ancestry and FTDNA identify European origins as my primary ethnicity (76% per Ancestry, 80% per FTDNA). Ancestry breaks this into three sub-regions: the largest being Western Europe (Figure 1), and the Iberian Peninsula (Figure 2) tied with Scandinavia (Figure 3). This seems very much in line with the German, Dutch, French, and Spanish origins claimed in my adoption letter. FTDNA however breaks this down into four sub-regions: with the largest being the British Isles, followed by Southern Europe, then Western & Central Europe, and finally Scandinavia (Figure 6). My adoption letter mentioned nothing indicating genetic roots in the British Isles. Yet, if you look at Ancestry’s full ethnicity estimate overview (Figure 5), Ancestry does calculate some British Isles origins in my DNA.
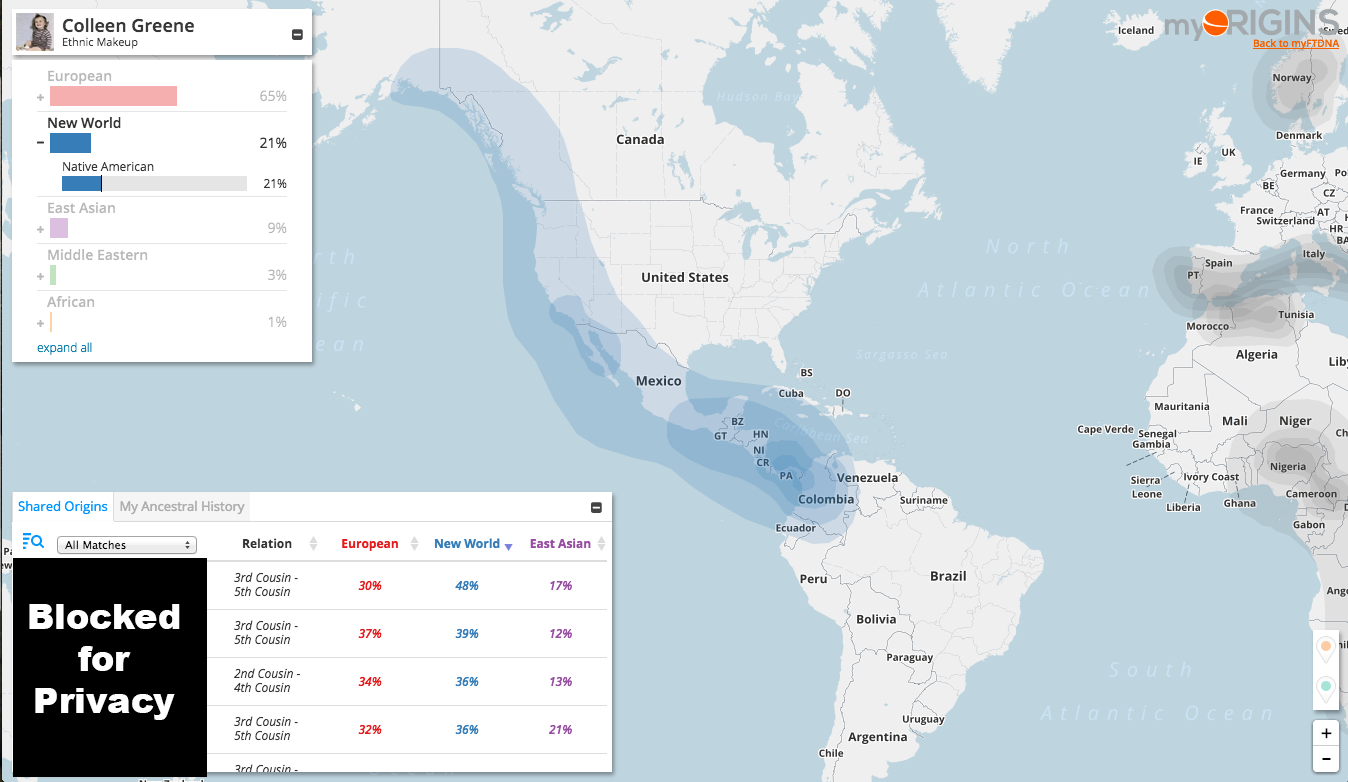
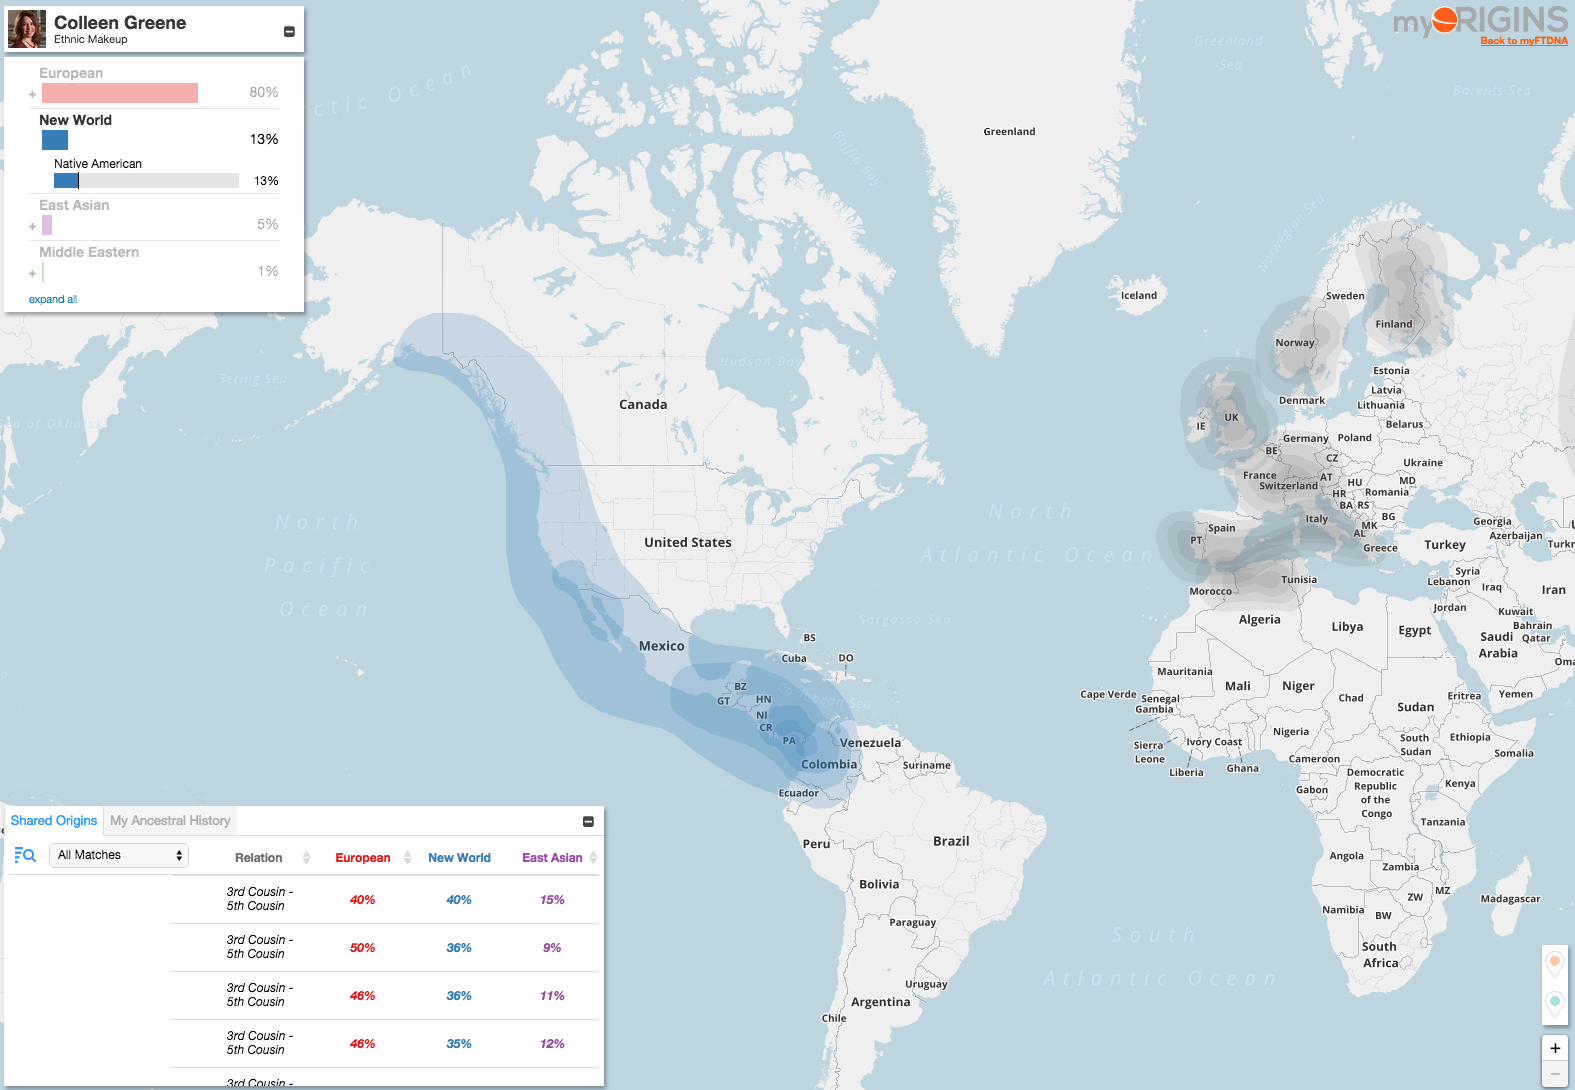
Native American (indigenous peoples) ancestry is identified by both companies as my second largest ethnic region of origin, in the New World (the Americas). This is that Mexican part that I suspected my adoption letter misattributed as just Spanish, so it is not a surprise to me. Although who knows, perhaps I have some actual true Native American (American Indian) in me too! What is surprising though, is that like I saw with Dad’s DNA, the two companies have a discrepancy in numbers. Ancestry estimates 21% (Figure 2), while FTDNA only estimates 13% (Figure 7). But as I mentioned in the post about Dad, Ancestry includes a much larger geographic area than FTDNA in its Native American region.
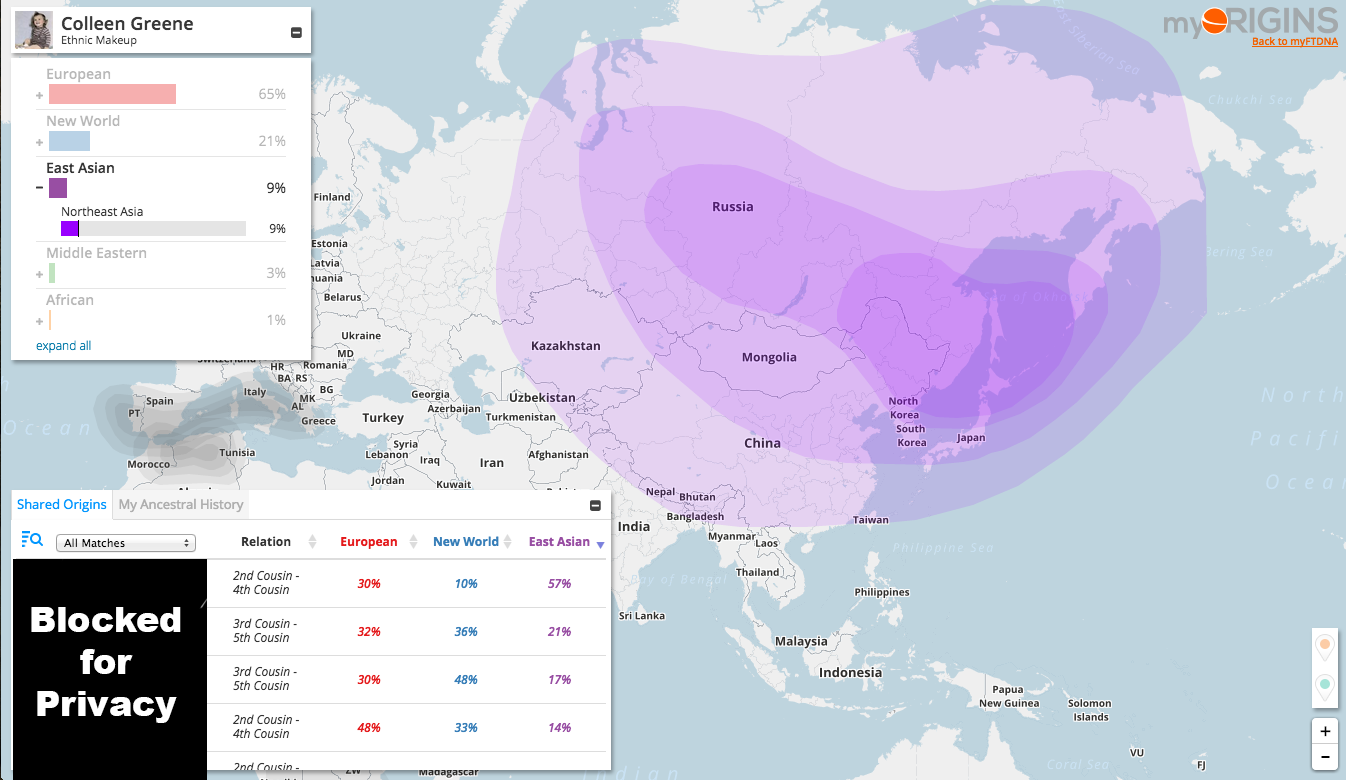
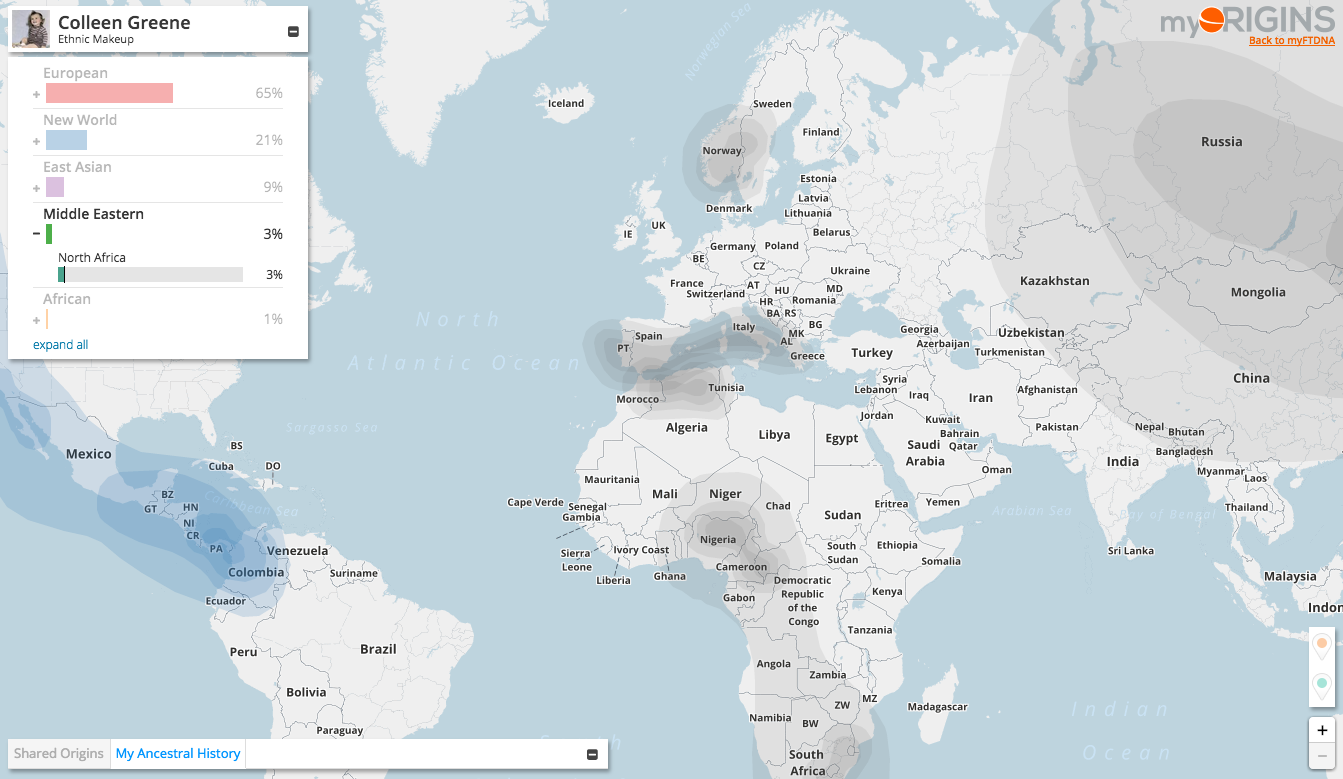
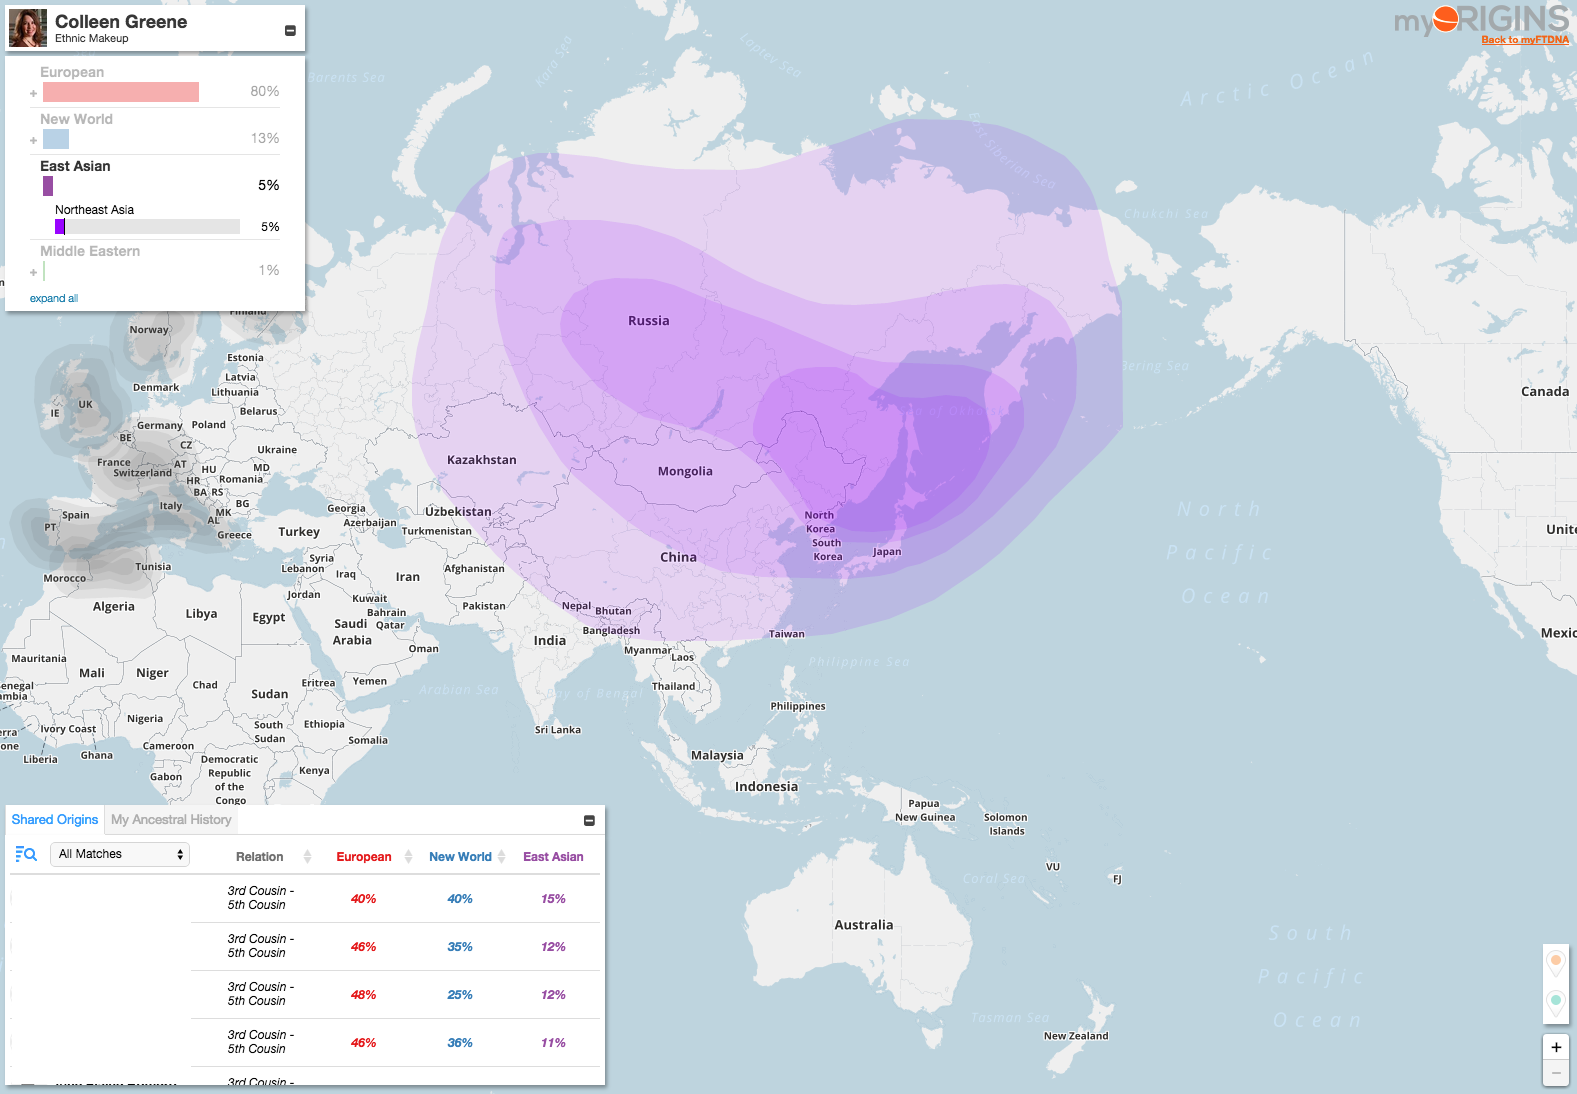
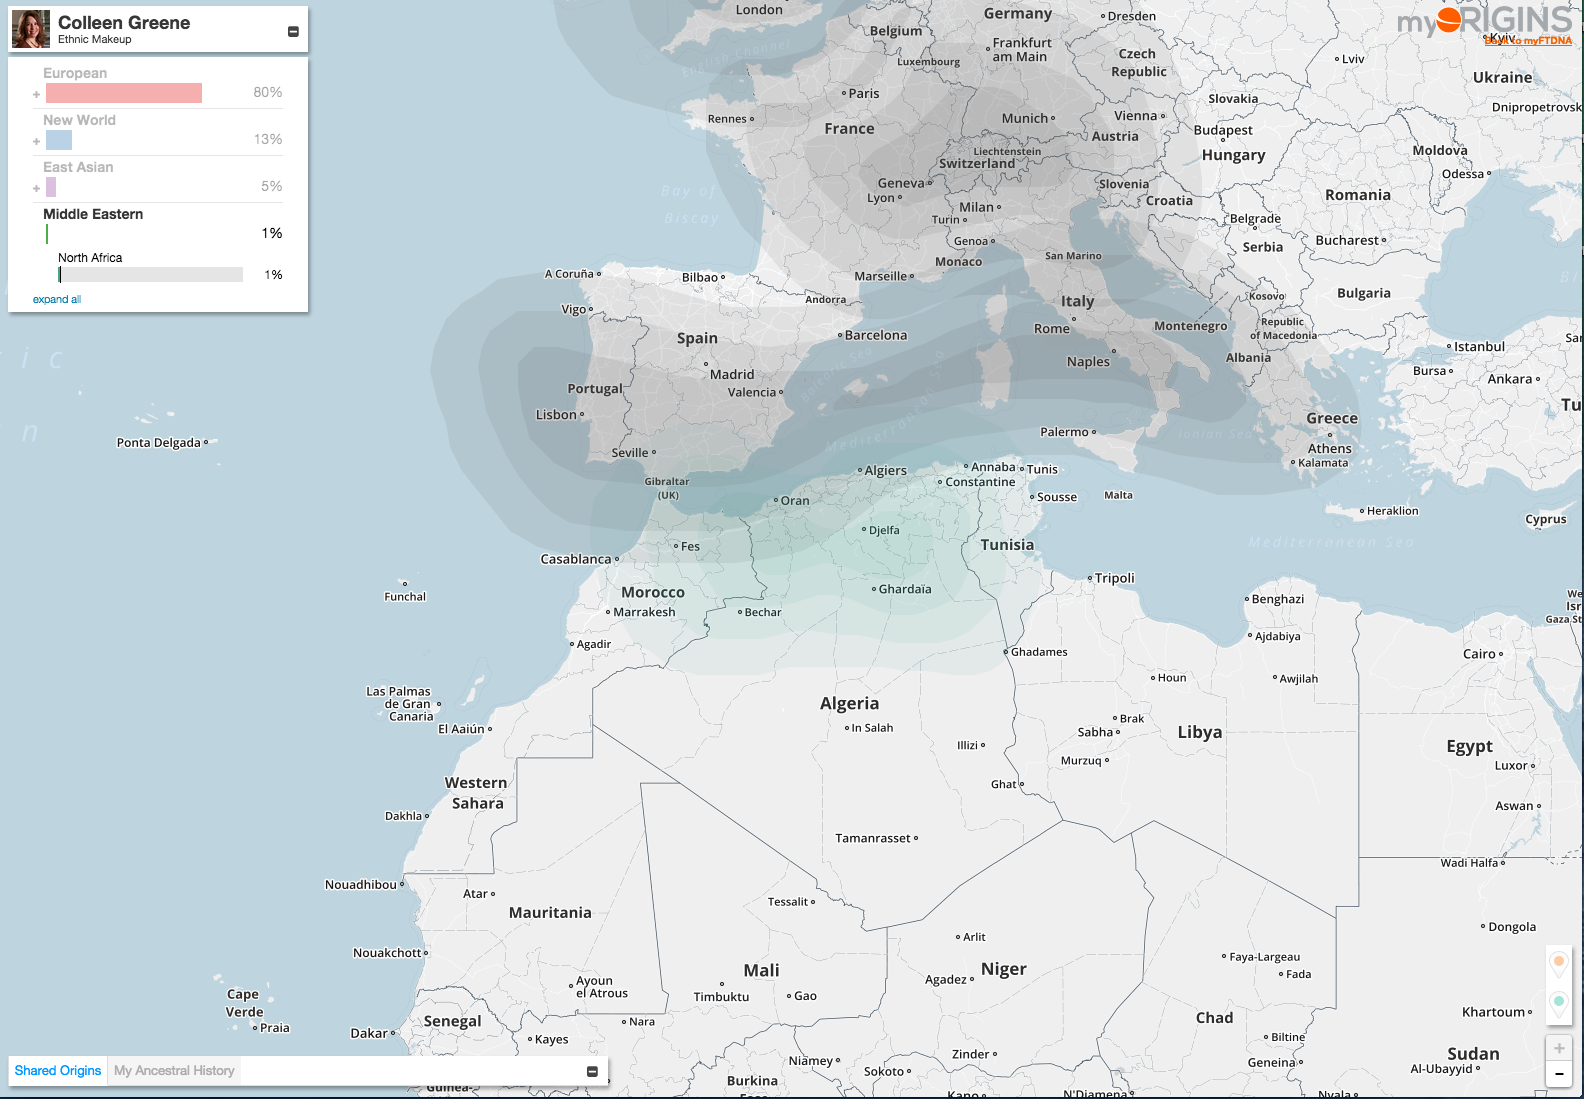
The African, Asian, and Middle Eastern estimates get harder to interpret because the estimates are much smaller, and because each company classifies these differently (Figures 5 and 10). Ancestry puts North Africa as a sub-region under Africa, while FTDNA puts it as a sub-region under Middle Eastern. Yet Ancestry identifies the Middle East as a sub-region of West Africa.
AncestryDNA
Following are the visual representations for how AncestryDNA interprets my ethnicity. See this blog post from Ancestry.com to learn how they estimate ethnicity.
Family Tree DNA
Following are visual representations of how FTDNA interprets my ethnicity.
Note that FTDNA shows you Family Finder Matches, genetic cousins in their database, who share your ethnic origins for your top three ethnic groups.These get displayed on the maps as Shared Origins (I have blocked out the names and faces of my matches, to respect their privacy). FTDNA members must opt-in to allow matches to see their ethnicity as Shared Origins. AncestryDNA does not provide this type of visual aid for genetic cousins and ethnic origins; you have to open up each individual cousin match to see their ethnicities.
What About the Irish?
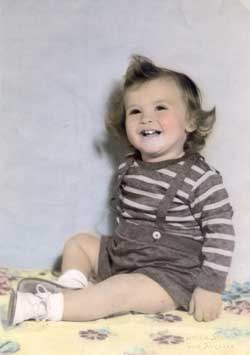
Based on my adoption letter, I assumed this Colleen was just Irish by cultural inheritance.
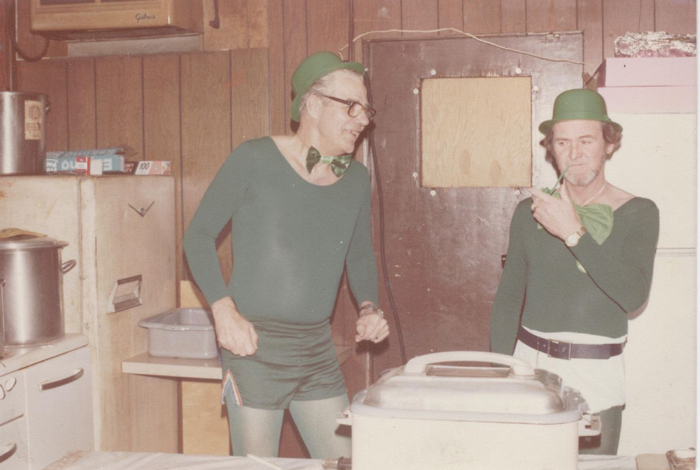
But it is just simply impossible for one to have a grandfather with a name like Michael John Flanagan, who proudly dressed up as a leprechaun every St. Paddy’s Day, if one were not Irish.
Because Ancestry estimates I am 6% Irish (Figure 5), and FTDNA must surely account for some Irish in its 30% of British Isles ethnicity (Figure 6).
 I have blogged about the long-time brick walls I faced for almost 15 years with my dad’s family history, both on